De nombreux évènements récents sont venus bouleverser les équilibres politiques ou économiques mondiaux. En effet, le Brexit, la Covid-19 ou la guerre commerciale menée par les autorités américaines et chinoises engendrent des incertitudes et des tensions sur les marchés boursiers et commerciaux. Pour cette raison, il est pertinent de faire le point sur les chiffres du commerce mondial pour évaluer la situation et comprendre l’importance sans cesse grandissante des échanges internationaux dans le commerce du XXIe siècle.
Le volume des échanges mondiaux de marchandises
Pour commencer, voici quelques chiffres généraux sur les échanges commerciaux mondiaux fournis par la Banque mondiale.
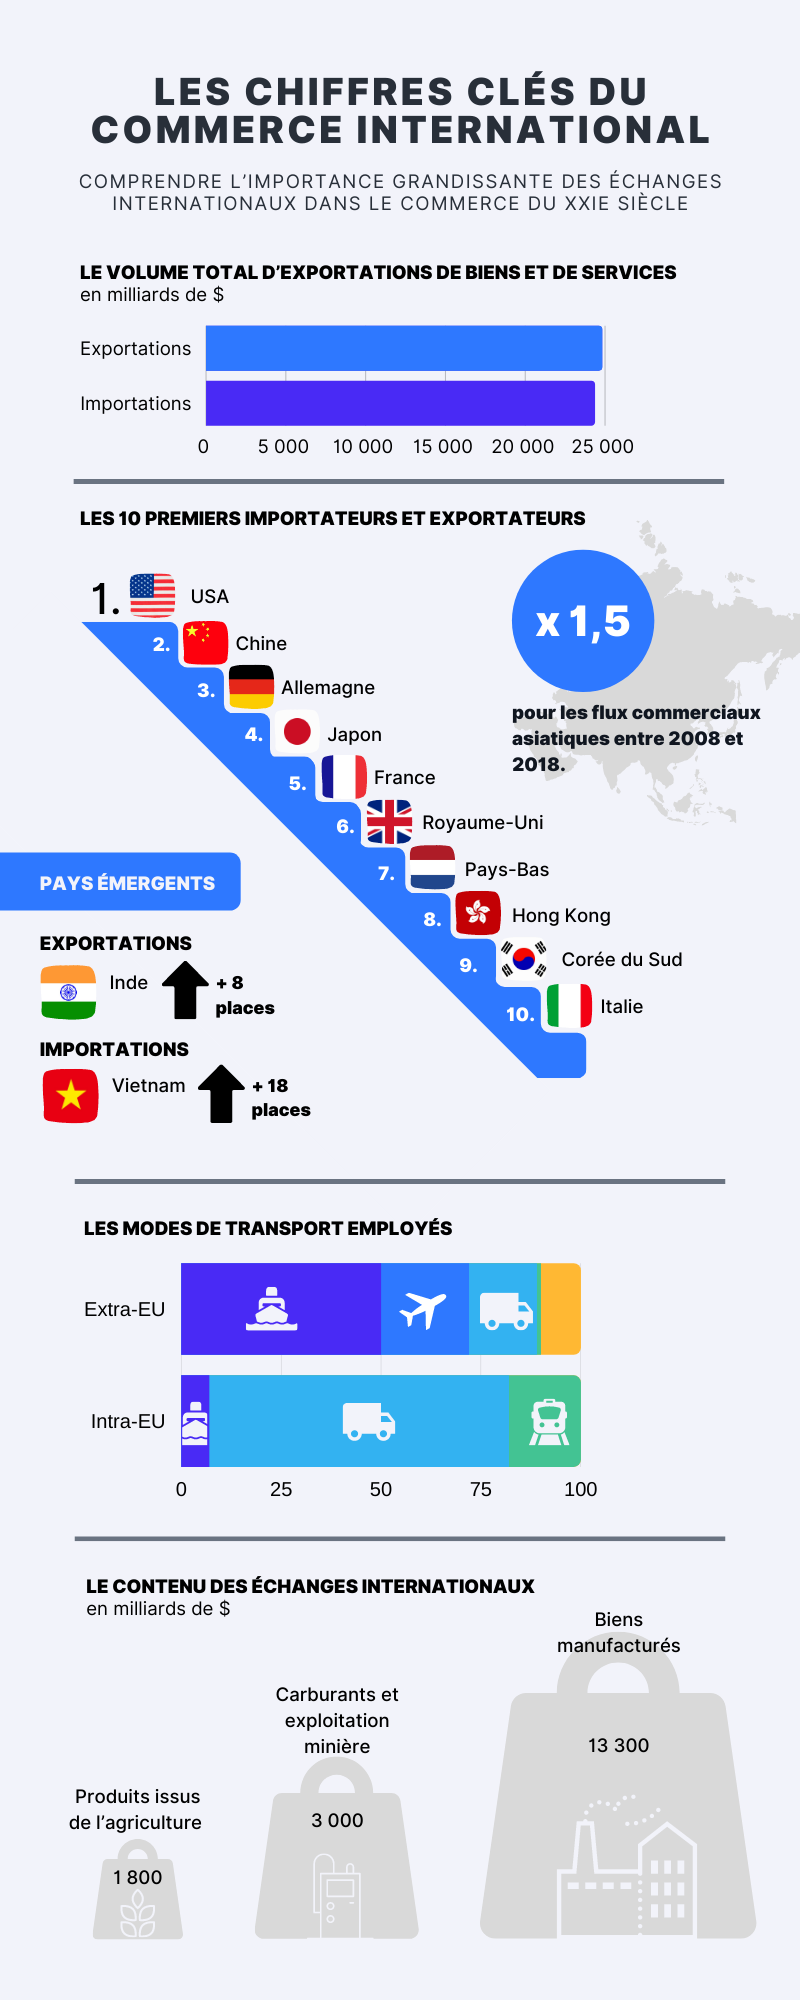
- En 2019, le volume total d’exportations de biens et de services s’élevait à 24 795 Mds de $
- Le volume total des importations de biens et services était quant à lui de 24 312 Mds de $
- Le commerce international composé des importations et exportations représente ainsi plus de 60% du PIB mondial
Les principaux acteurs du commerce international
D’après l’OMC (l’organisation mondiale du commerce), 10 économies seulement représentent 53,3% du commerce mondial de marchandises. Ce classement est établi en additionnant importations et exportations :
- Les États-Unis
- La Chine
- L’Allemagne
- Le Japon
- La France
- Le Royaume-Uni
- Les Pays-Bas
- Hong-kong
- La Corée du Sud
- L’Italie
Le classement concernant le commerce de services est sensiblement le même :
- Les États-Unis
- La Chine
- L’Allemagne
- Le Royaume-Uni
- La France
- Les Pays-Bas
- L’Irlande
- Le Japon
- L’Inde
- Singapour
Il faut noter le dynamisme de l’Asie. En effet, les flux commerciaux asiatiques ont été multipliés par 1,5 entre 2008 et 2018.
En outre, certains pays dits émergents ont su rapidement évoluer dans le classement mondial. L’Inde a par exemple gagné 8 places en termes d’exportations tandis que le Vietnam est grimpé de 18 places dans le classement mondial des pays importateurs.
Les modes de transport employés
Au niveau mondial, différents modes de transports permettent les échanges de biens et de services. Cependant, la proportion de chaque type de transport dépend du continent ou du pays.
Échanges intracommunautaires
Ainsi, en 2018, la part du fret intérieur par mode de transport dans l’UE-28 se répartissait de la façon suivante :
- Transport routier (74,9%)
- Transport ferroviaire (18,4%)
- Transport par voies navigables (6,7%)
En 2014, des études ont estimé à 2 200 Mds de tonnes-kilomètres le volume de transport de marchandises à l’intérieur de l’UE.
Échanges extracommunautaires
Bien entendu, lorsque le continent échange avec les partenaires commerciaux hors du continent, le mode de transport privilégié reste le transport par fret maritime. Ce dernier représente en effet près de 50% du volume d’importation et 60% pour l’exportation d’après une étude Eurostat.
Ainsi, chaque pays, zone économique ou continent s’adapte à la croissance du commerce mondial et la hausse des échanges en privilégiant le mode de transport le plus adapté à l’échange concerné.
Le contenu des échanges internationaux
Les volumes diffèrent grandement en fonction des types de biens ou services échangés.
Ainsi, en 2019, voici en milliards de $ la part du commerce de biens par secteur :
- Produits issus de l’agriculture : 1 800 Mds
- Les carburants et l’exploitation minière : 3 000 Mds
- Les biens manufacturés : 13 300 Mds
Comme nous pouvons l’observer, le volume mondial pour le commerce de biens manufacturés est largement majoritaire.
Pour le commerce international de services, la répartition est la suivante :
- Services liés à des produits manufacturés : 196 Mds
- Transport : 1 118 Mds
- Le tourisme : 1 416 Mds
- Autres services commerciaux : 3 168 Mds
L’impact écologique du commerce mondial
Toutefois, l’impact sur la planète des échanges économiques et commerciaux est important. Ainsi, selon une publication de la banque de France, la production et la commercialisation des biens et services échangés représentaient près de 25% des émissions nocives en 2015.
Cependant, l’UE a décidé de prendre les choses en main en incluant les émissions du secteur maritime dans le système européen d’échanges de quotas d’émission CO2 (SEQE-UE).